Translate

martes, 29 de abril de 2014

Still in a bull market

DJ Resistance:  16.631        All-time high
                            16.576.66   All-time closing high

DJ Support:       16.310        50 days moving average (50 MA)
                           16.174        November peak
                           16.015        Strong

DJIA is still in the range DJ16.015 - 16.631.
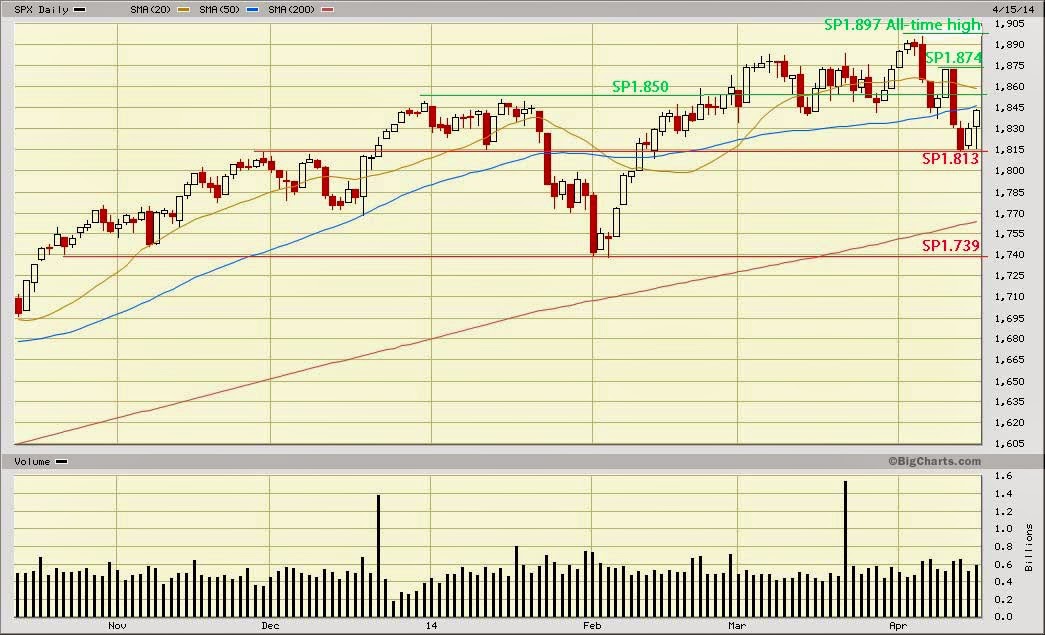
What I found important is that the DJ and S&P bounced up from its 50 days moving average (DJ16.310 on Monday) which means both index have drawn buyers in those levels. Technically it is a strong reaction for the upside to strike the all-time closing high DJ16.576,66.
The majors resistances according to the technical analysis need three, four or five attempts to sweep them away.
We are still in a bull market (watch five years daily chart positive channel). The range that has been developed in the last six months is a sign of the market consolidation. We have to pay attention to the momentum, if the DJIA loses it we could face a deep correction.
Technical analysis shows a bullish trend with momentum for the market, we have to watch every day S&P1.850 as strong support for all the market.
I am struck the low volume of the last days.
Please click over the chart to enlarge it

Fundamentals:
April is ending and the DJIA is still in the range. Earnings are positive this second trimester so far. There are important economic news this week like unemployment rate, non-farm payroll, ADP employment, GDP, personal income, consumer spending, factory orders and so on. These news and earnings should move the market and break the range.
DJIA and S&P are pointing up while NASDAQ is lagging. I think that institutions are relocating their positions that means that they have sold Nasdaq shares to take positions in S&P and DJIA stocks.
Remember the saying  "sell in May and go away", is it going to be true this year?
Dear traders and investors, I feel sorry not to give you more lights this time. I indicated in the first week of March that the market was without fuel to go up and we should wait for the earnings season, we are in right know and the DJIA is still in the range. I mentioned last week too that we were ready for the new highs but we were not yet in. Look always for the facts, trading and investments are not dreams or game of chance, they are sciences. Keep cool and be rational! I am still bullish but I have to follow the market, I am not a story teller or I think that the market has to follow me.
Good luck, viel Glueck, buona fortuna, buena suerte, bonne chance!
Ulises


martes, 22 de abril de 2014

Earnings season, still in a range

DJ Resistance:   16.631       All-time high
                             16.576,66  All-time closing high

DJ Support:         16.450
                             16.174       November peak
                             16.015       Strong

Technical Analysis:
The DJIA and S&P sharp reversal from the April low have put these index in a position to strike their all-time highs.
The DJ broke up today the resistance at DJ16.450 and tried to strike the all-time closing high DJ16.576,66 (Dec 31st. 2013) and the 2014 peak DJ16.573. A close above those resistances will open the way to its all-time high DJ16.631 and ready for new historical highs.
In summary the DJIA is still in a range (DJ16.015 - 16.631) and technically it has to take profit of the momentum because there is not trend definition right now. We cannot to affirm according the technical analysis that it is going to be higher or lower.

Please click over the chart to enlarge it.

Fundamentals:
Not too much to comment this week, the DJIA is still in the range. This magnificent bounce from the important support DJ16.040 was done by the positive beginning of the earnings season, 60% of the results have been better than expected. Pay attention to the low volume during the bounce up, this is not good.
This week there are not important economic news to move the market but earnings should be the fuel to do that.
I think if we see new historical Dow Jones Index Average highs will be caused by the corporate profits that we will face during this season.
Dear traders and investors, keep cool yourself, we are near to the new highs, only near not yet on. Nothing is written or given but I think that the earnings will be positive this quarter.
I prefer this week to watch the company's results instead of economic explanations. I explained to you that the poor figures during winter were due to the weather not for a bad economy paying attention that January and February inventories have increased.

I invite you to see this Paul Krugman interview about Thomas Piketty's book and if possible to read "Le Capital au XXI Siecle" about inequality.  http://krugman.blogs.nytimes.com/2014/04/19/my-head-talks-piketty-with-bill-moyers/?_php=true&_type=blogs&smid=tw-NytimesKrugman&seid=auto&_r=0

Good luck, viel Glueck, buona fortuna, buena suerte, bonne chance!
Ulises

martes, 15 de abril de 2014

Consolidation range

DJ Resistance:  16.631      All-time high
                            16.600
                            16.450

DJ Support:        16.174      November's peak
                            16.015      Strong
                            15.721      Very strong
                            15.340,23 Strong

Technical Analysis:
The market continues in a consolidation range. What does it mean? It means equality between bulls and bear forces and the lack of conviction to remain over the new historical highs. Six weeks ago I mentioned that we would see S&P1.900 and very probably SP2.000 this year. We almost got the first target at SP1.897. The problem is that right after the new highs the index goes down to the support of the range.
I would like you to pay attention to last Thursday the support DJ16.174 (November's peak) worked very well and last Friday the support at DJ16.040 worked too, not exactly (DJ16.015). Monday's bounce up put the DJ at DJ16.173 (almost DL16.174 November's peak) like a resistance before the closing. It is to show you that the supports and resistances have worked technically.
Technically again, the damage in the S&P and DJIA is seriously and to neutralized it the DJ has to close over the November's peak and 50 days moving average and it did it this Tuesday. The S&P has to close over its 50 days moving average (SP1845) and SP1.850 (December and January peak) but still did not. I conclude with a bearish bias right now.
It seems to me that the market needs a deeper correction to offer lower stock prices to the investors and I am sure they are going to buy them.

Please click over the charts to enlarge them


Fundamentals:
The market is in a new earnings season and it should be the fuel to brake the new range DJ16.015 to 16.631.
After analyzing the winter figures I accept that the bad weather has influenced the economy although I realize that the inventories grew on January and February. We are facing mixed economic news and the economy is growing. For me, the corporations are in shape and it is very possible that their earnings are going to be positive. My question is still about jobs and consumption. The 80% of the new jobs are U.S. $13.50 per hour or less, with those figures we cannot expect a strong internal consumption. 
Dear traders and investors, let's trade the earnings season. Technically I think the market needs a deeper correction to offer excellent opportunities to buy, and fundamentally, the same. Personally I expect a good earnings season, this is a contradiction because if there, will be not a possibility for a deeper correction.

Good luck, viel Glueck, buona fortuna, buena suerte, bonne chance!
Ulises

martes, 1 de abril de 2014

April: fuel for the stock market?

DJ Resistance:  16.588,25  All-time high
                            16.576.66  All-times closing high
                            16.520

DJ Support:        16.174       November's peak
                            16.040       Strong
                            15.721       Very strong
                            15.340,23  Strong

Technical Analysis:
DJIA closed March at DJ16.457 which is two months closing high after having been consolidated during this period.
Finally today, the DJ had the conviction to attack the strong resistance at DJ16.520 and closing slightly above that level. S&P did new record high.
This time NASDAQ is lagging DJIA and S&P
The DJ has consolidated during the last six weeks in the range DJ16.040 to 16.500. The upper limit was broken this Tuesday and the DJ has to overcome its all-time high DJ16.588,25 to get new territories.
The DJIA and S&P are facing a new potential "V" reversal where de vertex are at the February's low, DJ15.340.23 and S&P1.740 as indicated on February 18th. update. Remember the last DJ "V"Reversal had its vertex on the October's low and it worked perfectly. This break up could last 1.000 DJ points.
Technically the U.S. stock market remains bullish and ready to go higher in April.
The technical analysis does not read the future, it analyses the market behavior at the moment comparing with history.

Please click over the charts to enlarge them


Fundamentals:
Well, we have begun the month of April. Technical analysis points to the upside clearly and is showing momentum.
Fundamentals are mixed. We have to get the U.S.A PBI first quarter figures and determine the bad weather influence on them.
First quarter earnings season is going to begin in 15 days and I think it is going to bring fuel to the market. Meanwhile, we are going to get important economic news this week: Wednesday ADP employment, Thursday ISM Services and Friday March employment figures. They can spark an up or down movement in the stock market, please work accordingly to supports and resistances. No emotions!
Waiting for the PBI first quarter the tilt is up. We are not fortune teller, we look for information, analyze it, study it and get conclusions.

Dear traders and investors, go to April's battle with cold mind. We are waiting for this from three weeks ago.

Good luck, viel Glueck, buona fortuna, buena suerte, bonne chance!
Ulises