Translate

miércoles, 28 de febrero de 2018

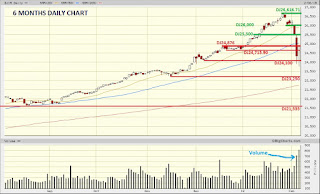
Nice spike

DJ Resistance:  26,616.71  All-time high
                           26,000
                           25,800.35
                           25,500

DJ Support:      25,400
                           25,245       50 Days moving average
                           25,080       20 Days moving average
                           24,876       2017 peak
                           24,719       2017 close
                           24,715.19  Support of old range
                           24,500
                           24,100
                           23,950
                           23,600
                           23,500       Gap upside
                           23,480       Gap downside
                           23,250       Strong
                           23,174
                           23,002       Strong, gap
                           23,001       200 Days moving average
                           22,890
                           22,795
                           22,420       Strong, breakout
                           22,119
                           22,000
                           21,912
                           21,600
                           21,535       July peak

Technical Analysis:
DJIA and S&P have had a nice spike sleeping two days over the 20 and 50 days moving average, this is bullish.
In the mid-February both indexes nailed a major support DJ23,250 and SP2,531 (200 days moving average and from them they bounced up to get the today's levels. The February low should be the bottom of this correction, there is not any confirmation at this moment.
Last week both touched major support 2017 peak DJ24,876 and SP2,695 and bounced up showing a constructive price action.
The trend is up and is streghten.

Please click over the chart to enlarge it.


Fundamentals:
Yesterday the market reversed earlier gains and ended the day with a loss due to Mr. Jerome Powell's comments to Congress, new Fed's President, about four interest rates hike during 2018 instead three as the market expected initially. It was based in his higher revised perspective on the economy. The market thought immediately that the stocks prices were confronted with higher interest rates and took profit.
This is not the case, we are facing an excellent outlook on the economy which is very positive for the corporations and consumers therefore I expect at least 10% gains this year. What the FED sees is a strong and growing economy in an excellent market conditions capable to swallow the interest hikes. The inflation rate is under control.
The market is basing as I have explained before and preparing for the next leg up. It is very possible to see great volatility on the financial markets in the next weeks and months before the up action. This volatility is necessary for the basing or process. The support at DJ23,250 is very important and it would determine if we have seeing the low of these consolidation.

Dear traders and investors, take profit of the pullbacks buying on the dips.

Good luck, viel Glueck, buona fortuna, buena suerte, bonne chance!
Ulises


miércoles, 21 de febrero de 2018

DJIA over important resistances but retraced on Tuesday

DJ Resistance:  26,616.71  All-time high
                           26,000
                           25,500
                           25,410       20 Days moving average
                           25,212       50 Days moving average
                           25,000
                         
DJ Support:      24,876       2017 peak
                           24,719       2017 close
                           24,715.90  Support of old range
                           24,500
                           24,100
                           23,950
                           23,600
                           23,500       Gap upside
                           23,480       Gap downside
                           23,250       Strong
                           23,174
                           23,002       Strong, gap
                           22,941       200 Days moving average
                           22,890
                           22,795
                           22,420       Strong, breakout
                           22,119
                           22,000
                           21,912
                           21,600
                           21,535       July peak

Technical Analysis:
We have seeing an attempt to recover the way to the upside. The three indexes have bound from February lows, this bounce is still weak and feeble, we can witness new downwards move. The attempt to the higher label is constructing and possible repairs the chart damages, it is too early to define it. DJIA broke up clear strong resistance at DJ24,719 (2017 close) and 24,876 (2017 high). Now they are working as supports. DJIA and S&P are fighting with strong resistances right now.
DJIA mayor resistance is at DJ25,212 (50 days moving average) and the support is 2017 peak DJ24,876. This resistance and support are forming the range.
S&P, DJIA are retesting the 50 days moving, fundamental resistance.
The long trend is bullish.

Please click over the chart to enlarge it.

Fundamentals: 
Last week was impressive with six positive days in a row. Are we out of the woods? No, we are going to witness volatility in the next weeks and maybe months. The market is going to move higher and lower. What we have to determine is if the February low is the low of the correction. It is very possible. Pay attention to the market that is creating a new base before the next leg up.
The market is bullish, this is unquestionable and it is based on the tax cut, the solidity of the consumption and the strength of the economy.
Consumer Confidence rose to 99.9 from 95.7 previous month. E-Commerce retail sales at 3.2% quarter to quarter from 3.6% pace previous. Housing starts 1.326 million units annualized from previous months 1,192 units.

This correction was long awaited and now we have to live with it.
Dear traders and investors, keep calm and buy on the dips, do not lose these opportunities. Right now, with the economy, tax cut and the consumer's expectations we can foresee about10 to 15 % gains for 2018.

Good luck, viel Glueck, buona fortuna, buena suerte, bonne chance!
Ulises

miércoles, 14 de febrero de 2018

Rebound?

DJ Resistance:  26,616.71  All-time high
                           26,000
                           25,542       20 Days moving average
                           25,500
                           25,089       50 Days moving average
                           25,000
                           24,876       2017 peak
                           24,719       2017 close
                           24,715.90  Support of old range

  DJ Support:    24,500
                           24,100
                           26,950
                           23,600
                           23,500       Gap upside
                           23,480       Gap downside
                           23,250       Strong
                           23,174
                           23,002       Strong, gap
                           22,922       200 Days moving average
                           22,890
                           22,795
                           22,420       Strong, breakout
                           22,119
                           22,000
                           21,912
                           21,600
                           21,535       July peak

Technical Analysis:
DJIA and S&P have rest at the resistances corresponding to the 2017 high and 2017 close DJ24,719, DJ24,876 and SP2,673, SP2,695. It is very important for the bulls and for the market recovery to overcome those levels. The retest could take some time.
The February low is the lowest level in three months. We can determine as a breakout point the 2017 high and close.
The three indexes are digesting the February damages, the market is trying to bounce up and is capped at the resistances indicated before.
The primary uptrend continues very clear but the mid-term trend is bearish.
Last week S&P tested support at 200 days moving average and bounced up.

Please click over the chart to enlarge it.

Fundamentals:
The market is trying to stabilize and bouncing up. The markets have had a rapid and fierce correction. This last we were expecting and as it was long belated it could explain the frenetic movement, a 10% correction. We saw a profound profit taking, technical trading but fundamentals remain the same. The economy is doing well, the PIB is growing over 2.5 % p.a., the corporation earning are growing due of the market and the tax cut, and the consumers are well positioned.
Have we seeing the bottom of this correction? It is not possible to affirm that, the market could continue with ups and down. What we have to understand is that this correction is healthy for the market and will provide new opportunities to buy in the dips.
Next FED meeting is in March and they have announced three hikes of the interest rates for this year. We could define the consolidation range for the next months is the Friday's low and the all-time high. It is a broad range.
NFIB Small Business Optimism Index is at 106.9 from last month 104.9. With all the economy and momentum support there is future for the small business, pay attention to them.
Dear traders and investors, calm down and expect volatility, the trend is to the upside technically and  fundamentally supported by the economy. Financial markets are not easy. My advice is buy your selected stocks in the dips.

Good luck, viel Glueck, buona fortuna, buena suerte, bonne chance!
Ulises


miércoles, 7 de febrero de 2018

DJIA,S&P: Major supports were violated

DJ Resistance:  26,616.71  All-time high
                           26,000
                           25,912       20 Days moving average
                           25,500
                           25,079       50 Days moving average
                           25,000

DJ Supports:    24,876       2017 peak
                           24,715.90  Support of old range
                           24,500
                           24,100
                           23,950
                           23,600
                           23,500       Gap upside
                           23,480       Gap downside
                           23,250       Strong
                           23,174
                           23,002       Strong, gap
                           22,890
                           22,795
                           22,740       200 Days moving average
                           22,420       Strong, breakout
                           22,119
                           22,000
                           21,912
                           21,600
                           21,535       July peak

Technical Analysis:
Big damages were made in the down correction from recently highs. The bulls need to repair the charts if they still wants new all-time highs.
DJIA and S&P have broken down important supports like DJ25,904, DJ24,100, 20 and 50 days moving average, and 2017 peak. The last bounce up could stop the correction.
DJIA has done a 10% correction from the all-time high DJ26,616.71. The 10% correction market at DJ23,954.
DJIA and S&P need to form an extended base to look for a new leg that will send the market for a new all-time high.
The indexes are trending to lower levels and repairs are pending before to take the way to new all-time highs.
Please click over the chart to enlarge it.
Fundamentals:
The market is going down and up, this is a correction 10% in the DJIA and 9.2 in the S&P. The weakest index is NASDAQ Composite.
The economy is doing very well, the tax cut will generate better corporate profits in the big, mids and small ones.
This panic is about inflation coming from possible higher salaries, we know that interest rates will be raised three times this year and the market fears a runaway inflation.
On February 8th. we have the dateline for the Spending Bill, this is tomorrow. There is no agreement in the Congress until now.
I find this correction very healthy because it will put the stock market prices in their fair value. The correction was needed to forma a solid base before the next leg up looking for the new all-time high. I understand that it is hard to go through the correction phase when you have bought at a higher price or when you how you have lost the price profit in your positions. For me these times are nice opportunities to increase the positions at good prices and you will see more volume coming to the market, they are the investors who lost the last movements to the upside, this is really healthy.

Dear traders and investors, it is difficult to feel great during these days in the stock and bond markets. I ask you to be calm and look for the market opportunities, remember I was calling for a correction or profound consolidation phase before the next leg up. Financial market are very difficult to foresee but in this case we have a solid economy, excellent corporate earnings and stable consumption. All these are rational not a story from a fortune teller. Are we out of the woods? Actually I don't know but we will and i am still positive with the stock market.

Good luck, viel Glueck, buona fortuna, buena suerte, bonne chance!
Ulises