18,347.67 All-time closing
18,300 Light
18,171 April peak
18,104 2014 peak
18,016 Strong breakout
17,789 50 Days moving average
17,700
17,579 August inflection point
17,433 June low
17,325 May low 200 days moving average
17,125 Very strong
16,933.43 Strong September 2015 high
16,667 Inflection point
16,520
15,980 Strong
15,450 Strong
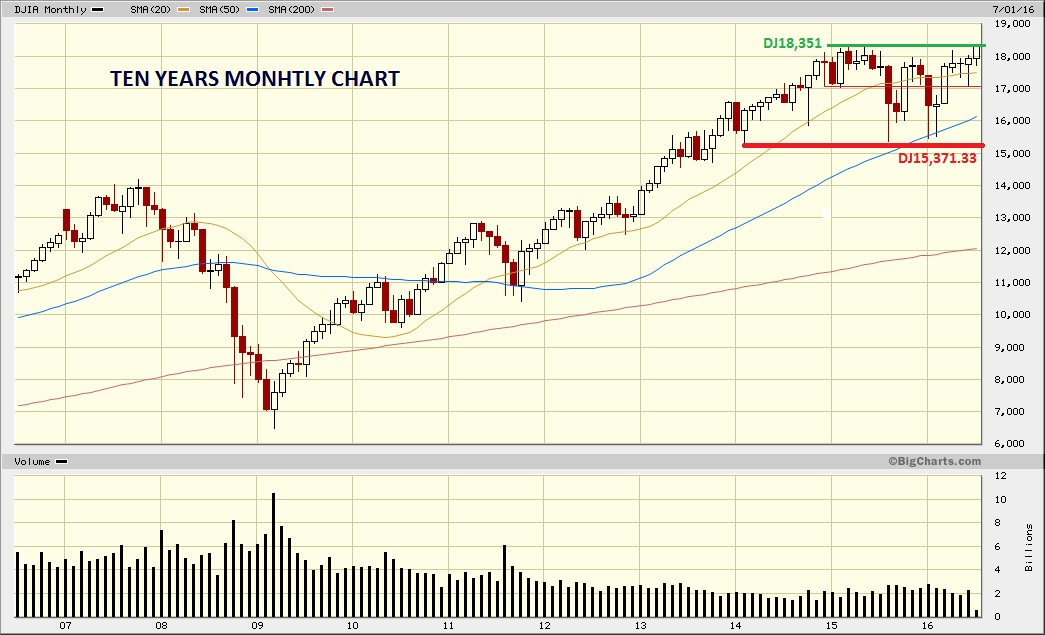
15,371.33 Very strong 2015 low
Technical Analysis:
DJIA and S&P have gotten new all-time levels and closings at the beginning of the third quarter, Wow!
This rally has the ground for a potential follow through, it has done the movement correctly accomplishing the rules of the technical analysis. We can comment that in the last years we have witnessed false breakout that means they did not follow through and then reversed.
Light supports will be the panning DJ18,000-18,012, this last is the 2015 closing high. Important supports are DJ18,171 (April peak) and DJ18,016. S&P supports are SP2,080 and 2,020.
Both the DJIA and S&P have absorbed the Brexit fall, DJ17,125, and bounced up eliminating resistance at DK18,016 and SP2,120. It took more than a year to break up the all-time highs to both indexes. And if you watch the chart you can realize that they have formed an interesting base to consider a solid follow through over the old all-time highs. I find that very bullish for both indexes and their backdrop remains bullish-leaning with positive perspective for the rally that we are witnessing now.
Pleasew click over the charts to enlarge them.

Fundamentals:
DJIA and S&P are in new highs and they could be higher. Firstable, the corporate earnings season is going to define the solidity of this upward move. Second, between investors there a lot of bears, investors and portfolio managers who are in cash because they did not expect this bounce up with new highs after Brexit. They think that they lost the beginning of the move and want to jump into the fortune wagon.
Dear traders and investors, we are going to face an intense market during this corporate earnings season. Markets wants higher levels and are thirsty of profits. They have waited more than a year for the new highs. Good earnings with growth are going to define this upward move before the summer doldrums. The next three weeks the market is going to be drive by emotions with rational earnings season besides the economic news, the last three important were positive as I indicated in the past blog.
Good luck, viel Glueck, buona fortuna, buena suerte, bonne chance!
Ulises


