DJ Resistance: 26,616.71 All-time high
26,000
25,800.35
25,400
24,876 2017 peak
24,719 2017 close
DJ Support: 24,472 50 Days moving average
24,411 20 Days moving average
24,280
24,100
23,500
23,250 Very strong
23,174
23,002 Strong, gap
22,890
22,795
22,420 Strong, breakout
22,119
22,000
21,912
21,600
21,535
Technical Analysis:
DJIA is near important resistances like the 2017 high DJ24,876 and 2017 close DJ24,719. S&P and NASDAQ Composite are almost doing the same. If they break those resistances the bulls would have an excellent opportunity to show their intentions.
Volume is weak in the last sessions.
In the short term the technical picture remains bearish-leaning. The important support area DJ23,250 - 23,500 stays unblemished.
Please click over the chart to enlarge it.
Fundamentals:
President's Trump announcement about the Iran deal has not caused a great reaction. The financial market is acting all in stride like the oil market. It seems that the 90 days grace period eliminates uncertainty. Opinions are split if the decision is positive or negative for the United States.
The Redbook numbers for the retails stores showed the sales increase in the same stores with a y/y gain of 4.2% compared to last month's 3.5%.
The number of job opening in U.S.A. surged in March to a record 6.55 million from 6.1 million
Employment is in shape and the last economic reports show strength in the economy.
Dear traders and investors, there are uncertainties and new rules participating in the geopolitical, the financial markets doesn't like them but they have to live with. Economy and consumption are healthy therefore a rise in the market should be underway.
Good luck, viel Glueck, buona fortuna, buena suerte, bonne chance!
Ulises
Translate
miércoles, 9 de mayo de 2018
miércoles, 25 de abril de 2018
Bearish in the Mid Term
DJ Resistance: 26,616.71 All-time high
26,000
25,800.35
25,400
24,876 2017 peak
24,719 2017 close
24,623 50 Days Moving average
24,280
24,256 20 Days moving average
24,100
23,500
23,250 Very strong
23,174
23,002 Strong, gap
22,890
22,795
22,420 Strong, breakout
22,119
22,000
21,912
21,600
21,535
Technical Analysis:
False breakout of the negative trend line and the 50 days moving average, this action indicates the bearish-leaning trend in the medium term. S&P dis almost the same.
DJIA could not to penetrate de resistance DJ24,876 (2017 peak) and returned below its 50 days moving average (DJ24623). If you watch the S&P chart you will realize the same behavior.
DJIA has to close over DJ24,876 (2017 peak) to bring back the bulls.
The three indexes are below its 50 days moving averages and show a failed attempt to recover to the all-time highs.
DJ23,250 should be a strong and an extraordinary support. The correction range is DJ23,250 - 26,616.71
Following the negative trend line (watch the chart) the trend in the midterm is bearish.
Please click over the chart to enlarge it.
Fundamentals:
The 10 year bond got 3% p.a. because sellers of bonds were active. That put the stock market in alert and we have witnessed how the bounce in April failed. Besides, Caterpillar showed excellent earnings in this first quarter with nice outlook in the future and announced that this one could be the stellar of this year that put the stock Caterpillar and the stock market in a sell mode.
We have to focus in the economy. Earnings season is excellent and we expect positive profits until the season's end. With the corporate tax cut the corporations foresees better benefits in the coming times and its expansions. Last GDP was 2.9% positive in the quarter. The economy is showing a vigorous job growth with low unemployment. The information that we are receiving indicates to us that we are in front of a bolstering economy with solid consumption and the consumer confidence almost in the highest levels.
Dear traders and investors, the market entered in a correction mode which is normal after the 2017 results. I had explained to you some months ago that the volatility would be with us in the next weeks and months. Economy is showing us the path to the expansion and very good times coming. That is what really counts. Concentrate in the facts, analyze them and buy the dips.
Good luck, viel Glueck, buona fortuna, buena suerte, bonne chance!
Ulises
26,000
25,800.35
25,400
24,876 2017 peak
24,719 2017 close
24,623 50 Days Moving average
24,280
24,256 20 Days moving average
24,100
23,500
23,250 Very strong
23,174
23,002 Strong, gap
22,890
22,795
22,420 Strong, breakout
22,119
22,000
21,912
21,600
21,535
Technical Analysis:
False breakout of the negative trend line and the 50 days moving average, this action indicates the bearish-leaning trend in the medium term. S&P dis almost the same.
DJIA could not to penetrate de resistance DJ24,876 (2017 peak) and returned below its 50 days moving average (DJ24623). If you watch the S&P chart you will realize the same behavior.
DJIA has to close over DJ24,876 (2017 peak) to bring back the bulls.
The three indexes are below its 50 days moving averages and show a failed attempt to recover to the all-time highs.
DJ23,250 should be a strong and an extraordinary support. The correction range is DJ23,250 - 26,616.71
Following the negative trend line (watch the chart) the trend in the midterm is bearish.
Please click over the chart to enlarge it.
Fundamentals:
The 10 year bond got 3% p.a. because sellers of bonds were active. That put the stock market in alert and we have witnessed how the bounce in April failed. Besides, Caterpillar showed excellent earnings in this first quarter with nice outlook in the future and announced that this one could be the stellar of this year that put the stock Caterpillar and the stock market in a sell mode.
We have to focus in the economy. Earnings season is excellent and we expect positive profits until the season's end. With the corporate tax cut the corporations foresees better benefits in the coming times and its expansions. Last GDP was 2.9% positive in the quarter. The economy is showing a vigorous job growth with low unemployment. The information that we are receiving indicates to us that we are in front of a bolstering economy with solid consumption and the consumer confidence almost in the highest levels.
Dear traders and investors, the market entered in a correction mode which is normal after the 2017 results. I had explained to you some months ago that the volatility would be with us in the next weeks and months. Economy is showing us the path to the expansion and very good times coming. That is what really counts. Concentrate in the facts, analyze them and buy the dips.
Good luck, viel Glueck, buona fortuna, buena suerte, bonne chance!
Ulises
jueves, 12 de abril de 2018
Bearish Short Term
DJ Resistance: 26,616.71 All-time high
26,000
25,800.35
25,400
24,876 2017 peak
24,758 50 Days moving average
24,719 2017 close
24,319 20 Days moving average
24,280
24,100
23,514 200 Days moving average
23,500
23,250 Very strong
23,174
23,002 Strong, gap
22,890
22,795
22,420 Strong, breakout
22,119
22,000
21,912
21,600
21,535
Technical Analysis:
DJIA trend in the midterm is bearish. From April low the market has bounced up as a limited correction in these moments. We have to pay attention if we are going to get a follow through running to the 2017 close and high. Those are the real resistances. S&P and NASDAQ Composite reached them.
DJIA 200 days moving average, a long term indicator, is acting as a fabulous support and in the case of DJIA have never been violated from June 2016. Same index in S&P and Nasdaq Composite was violated but the closings are over it.
DJ24,719 (2017 close), DJ24,876 (2017 high) are the important resistances. Also DJ24,758 (50 days moving average) which is pointing down is a strong resistance.
DJIA to take a big step in repairing the charts has to sleep over the negative trend line.
February and March have damaged the chart and the attempts to the up side and get a correction have failed that is why the trend in the medium term is bearish and in the long run is bullish.
Please click over the chart to enlarge it.
Fundamentals:
The fear of a trade war triggers the sales off, Syria situation is acting against the financial markets due the uncertainties. I do not expect a trade war but global geopolitics and especially President Trump initiatives brings instabilities to the markets. I expect the volatility will continue.
The economy is in shape, the inflation is a little bit higher but controlled by the FED. The interest rates are increasing according to the FED´s plan and corporate earnings season is starting. I expect positive corporation numbers.
Dear traders and investors, I don´t want to write at length about why I am positive with the growth in the economy, corporate earnings, unemployment and consumption. The important is to determine the bottom of this correction, I still expect DJ23,250 as the strong support. The good days are coming and we will test the all-time high. Volatility will continue the next days and maybe weeks. Buy the dips!
Good luck, viel Glueck, buona fortuna, buena suerte, bonne chance!
Ulises
26,000
25,800.35
25,400
24,876 2017 peak
24,758 50 Days moving average
24,719 2017 close
24,319 20 Days moving average
24,280
24,100
23,514 200 Days moving average
23,500
23,250 Very strong
23,174
23,002 Strong, gap
22,890
22,795
22,420 Strong, breakout
22,119
22,000
21,912
21,600
21,535
Technical Analysis:
DJIA trend in the midterm is bearish. From April low the market has bounced up as a limited correction in these moments. We have to pay attention if we are going to get a follow through running to the 2017 close and high. Those are the real resistances. S&P and NASDAQ Composite reached them.
DJIA 200 days moving average, a long term indicator, is acting as a fabulous support and in the case of DJIA have never been violated from June 2016. Same index in S&P and Nasdaq Composite was violated but the closings are over it.
DJ24,719 (2017 close), DJ24,876 (2017 high) are the important resistances. Also DJ24,758 (50 days moving average) which is pointing down is a strong resistance.
DJIA to take a big step in repairing the charts has to sleep over the negative trend line.
February and March have damaged the chart and the attempts to the up side and get a correction have failed that is why the trend in the medium term is bearish and in the long run is bullish.
Please click over the chart to enlarge it.
Fundamentals:
The fear of a trade war triggers the sales off, Syria situation is acting against the financial markets due the uncertainties. I do not expect a trade war but global geopolitics and especially President Trump initiatives brings instabilities to the markets. I expect the volatility will continue.
The economy is in shape, the inflation is a little bit higher but controlled by the FED. The interest rates are increasing according to the FED´s plan and corporate earnings season is starting. I expect positive corporation numbers.
Dear traders and investors, I don´t want to write at length about why I am positive with the growth in the economy, corporate earnings, unemployment and consumption. The important is to determine the bottom of this correction, I still expect DJ23,250 as the strong support. The good days are coming and we will test the all-time high. Volatility will continue the next days and maybe weeks. Buy the dips!
Good luck, viel Glueck, buona fortuna, buena suerte, bonne chance!
Ulises
miércoles, 4 de abril de 2018
Midterm Trend is Bearish
DJ Resistance: 26,616.71 All-time high
26,000
25,800.35
25,400
24,992 50 Days moving average
24,876 2017 peak
24,719 2017 close
24,500 20 Days moving average
24,280
24,100
23,431 200 Days moving average
23,250 Very strong
23,174
23,002 Strong, gap
22,890
22,795
22,420 Strong, breakout
22,119
22,000
21,912
21,600
21,535
Technical Analysis:
The beginning of the second quarter of this year continues showing the market deterioration.
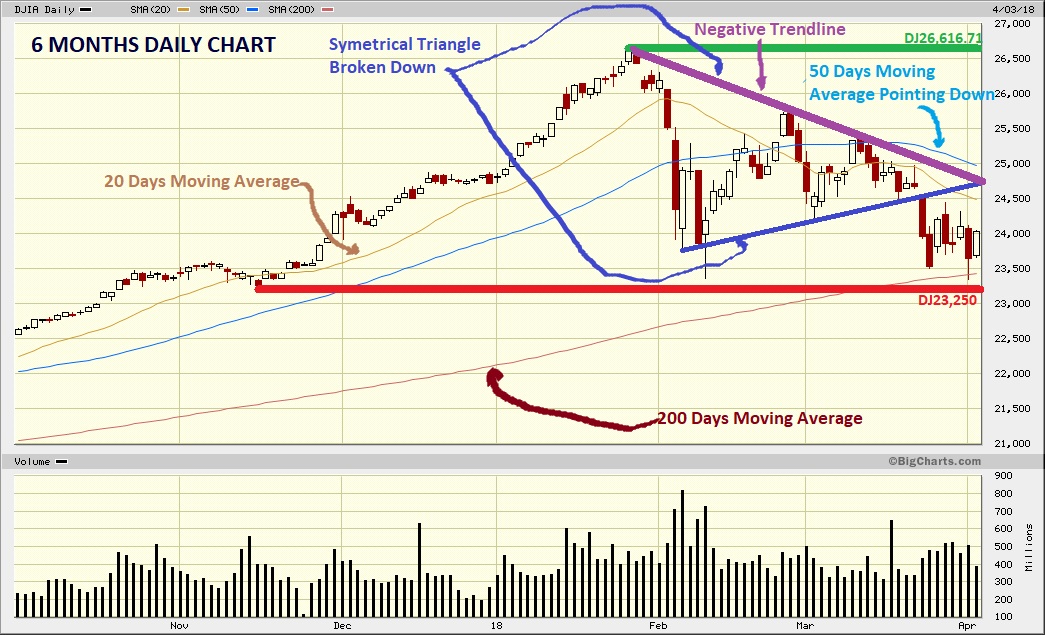
200 days moving averages works as strong support and is valid at DJ23,431. Other strong support is DJ23,250. Those supports should contain the DJIA although the breakdown of the symmetrical triangle positive trend line. This last breakdown is bearish. The upside attempts have failed when they have tried to break the negative trend line of the symmetrical triangle.
Bulls have to put DJIA over the negative trend line (watch the chart) to repair the chart damages. Other way the trend will continue to the downside.
50 days moving average is pointing down and DJIA is below it same as 20 days moving average. That is bearish.
Bulls target are DJ24,719 (2017 close) and DJ24,876 (2017 peak). Those targets are necessary for the bulls to stabilize DJIA and look for a next higher leg.
S&P have almost violated 200 days moving average.
NASDAQ Composite is set to test 200 days moving average at 6,753.
Conclusion: short and midterm have a bearish trend.
Please click over the chart to enlarge it.
Fundamentals:
S&P 500 index P/E is below 17 times at SP2,600. It is very attractive especially with a growing economy, increasing corporate earnings therefore institutional investors should be looking for the best opportunities in the stock market.
President Trump is intervening in the financial markets with the trade war and accusing Amazon with the low taxes payed by the corporation and its distribution cost through the Post Office. We wait for the next meeting with the dictator of North Korea.
S&P should get SP2,298 to confirm a correction (20%) and to risk to enter in a bear market below this support. The current correction right now is less than 15%. I consider hard to get that level because inflation is controlled, interest rates still are low or we can say accommodative, corporate earnings are in good shape with expectations to be better, the U.S. economy is strong and the global economy is widening or broadening.
Dear traders and investors, the only real risk is the trade war escalating because the excellent projections of the corporate earnings growth for this and next year will disappear. I don't think that it will occur meanwhile I am a buyer on dips and I am clear that volatility will continue being present in the next weeks.
Good luck, viel Glueck, buona fortuna, buena suerte, bonne chance!
Ulises
26,000
25,800.35
25,400
24,992 50 Days moving average
24,876 2017 peak
24,719 2017 close
24,500 20 Days moving average
24,280
24,100
23,431 200 Days moving average
23,250 Very strong
23,174
23,002 Strong, gap
22,890
22,795
22,420 Strong, breakout
22,119
22,000
21,912
21,600
21,535
Technical Analysis:
The beginning of the second quarter of this year continues showing the market deterioration.
200 days moving averages works as strong support and is valid at DJ23,431. Other strong support is DJ23,250. Those supports should contain the DJIA although the breakdown of the symmetrical triangle positive trend line. This last breakdown is bearish. The upside attempts have failed when they have tried to break the negative trend line of the symmetrical triangle.
Bulls have to put DJIA over the negative trend line (watch the chart) to repair the chart damages. Other way the trend will continue to the downside.
50 days moving average is pointing down and DJIA is below it same as 20 days moving average. That is bearish.
Bulls target are DJ24,719 (2017 close) and DJ24,876 (2017 peak). Those targets are necessary for the bulls to stabilize DJIA and look for a next higher leg.
S&P have almost violated 200 days moving average.
NASDAQ Composite is set to test 200 days moving average at 6,753.
Conclusion: short and midterm have a bearish trend.
Please click over the chart to enlarge it.
Fundamentals:
S&P 500 index P/E is below 17 times at SP2,600. It is very attractive especially with a growing economy, increasing corporate earnings therefore institutional investors should be looking for the best opportunities in the stock market.
President Trump is intervening in the financial markets with the trade war and accusing Amazon with the low taxes payed by the corporation and its distribution cost through the Post Office. We wait for the next meeting with the dictator of North Korea.
S&P should get SP2,298 to confirm a correction (20%) and to risk to enter in a bear market below this support. The current correction right now is less than 15%. I consider hard to get that level because inflation is controlled, interest rates still are low or we can say accommodative, corporate earnings are in good shape with expectations to be better, the U.S. economy is strong and the global economy is widening or broadening.
Dear traders and investors, the only real risk is the trade war escalating because the excellent projections of the corporate earnings growth for this and next year will disappear. I don't think that it will occur meanwhile I am a buyer on dips and I am clear that volatility will continue being present in the next weeks.
Good luck, viel Glueck, buona fortuna, buena suerte, bonne chance!
Ulises
miércoles, 21 de marzo de 2018
Are the bears comming?
DJ Resistance: 26,616.71 All-time high
26,000
25,800.35
25,400
25,304 50 Days moving average
24,990 20 Days moving average
24,876 2017 peak
24,719 2017 close
24,280
24,100
23,912
23,600
23,400
23,382 200 Days moving average
23,250 Very strong
23,174
23,002 Strong, gap
22,890
22,795
22,420 Strong, breakout
22,119
22,000
21,912
21,600
21,535
Technical Analysis:
The market is phasing an interest hike and fears of a trade war.
The bears have reemerged and DJIA has broken important supports like 50 days moving average, DJ24,719 2017 close and DJ24,876 2017 peak. DJIA is below 20 and 50 days moving average which is bearish.
DJIA has formed a symmetrical triangle and is near of the vertex. Probably the next backdrop is an explosion to the up or down side. Pay attention to this formation. The negative trend line of the symmetrical triangle shows lower highs that is bearish.
DJIA is the weakest if you compare with the S&P and NASDAQ Composite.
In the short and mid-term the trend is bearish. DJ23,250 should be a strong support and hopefully the downside of the correction.
On the contrary, S&P is over its supports like 2017 close, 2017 peak and 50 days moving average showing an intact recovery attempt.
Please click over the chart to enlarge it.
Fundamentals:
The market fears the Wednesday 3/21/2018 FOMC trade war and Facebook sell-off.
Personally, I think that the FED Meeting Announcement will raise the interest rates 25 basis points and this hike will calm down the markets. Trade war is different because it could affect the consumers. Facebook sell-off was originated due a bad press leak about customer data and millions of user profiles accessed by politicians. The Facebook stocks were sent down but it is a Facebook problem.
The hike of the rates will assure to the market the FED's confidence about the economy therefore I expect a bounce up of the market. The market is in a correction and consolidation phase, personally I expect DJ23,250 as a strong support in this phase but volatility is in place and it could be working for weeks.
Traders will pay attention to Fed's Chair Press Conference, it is the first one by the new Fed Chairman Jerome Powell after Janet Yellen.
Dear traders and investors, volatility is in the market and we have to live with it in the next weeks, hopefully not months. My suggestion is still "Buy the Dip".
Good luck, viel Glueck, buona fortuna, buena suerte, bonne chance!
Ulises
26,000
25,800.35
25,400
25,304 50 Days moving average
24,990 20 Days moving average
24,876 2017 peak
24,719 2017 close
24,280
24,100
23,912
23,600
23,400
23,382 200 Days moving average
23,250 Very strong
23,174
23,002 Strong, gap
22,890
22,795
22,420 Strong, breakout
22,119
22,000
21,912
21,600
21,535
Technical Analysis:
The market is phasing an interest hike and fears of a trade war.
The bears have reemerged and DJIA has broken important supports like 50 days moving average, DJ24,719 2017 close and DJ24,876 2017 peak. DJIA is below 20 and 50 days moving average which is bearish.
DJIA has formed a symmetrical triangle and is near of the vertex. Probably the next backdrop is an explosion to the up or down side. Pay attention to this formation. The negative trend line of the symmetrical triangle shows lower highs that is bearish.
DJIA is the weakest if you compare with the S&P and NASDAQ Composite.
In the short and mid-term the trend is bearish. DJ23,250 should be a strong support and hopefully the downside of the correction.
On the contrary, S&P is over its supports like 2017 close, 2017 peak and 50 days moving average showing an intact recovery attempt.
Please click over the chart to enlarge it.
Fundamentals:
The market fears the Wednesday 3/21/2018 FOMC trade war and Facebook sell-off.
Personally, I think that the FED Meeting Announcement will raise the interest rates 25 basis points and this hike will calm down the markets. Trade war is different because it could affect the consumers. Facebook sell-off was originated due a bad press leak about customer data and millions of user profiles accessed by politicians. The Facebook stocks were sent down but it is a Facebook problem.
The hike of the rates will assure to the market the FED's confidence about the economy therefore I expect a bounce up of the market. The market is in a correction and consolidation phase, personally I expect DJ23,250 as a strong support in this phase but volatility is in place and it could be working for weeks.
Traders will pay attention to Fed's Chair Press Conference, it is the first one by the new Fed Chairman Jerome Powell after Janet Yellen.
Dear traders and investors, volatility is in the market and we have to live with it in the next weeks, hopefully not months. My suggestion is still "Buy the Dip".
Good luck, viel Glueck, buona fortuna, buena suerte, bonne chance!
Ulises
miércoles, 14 de marzo de 2018
NASDAQ new all-time high
DJ Resistance: 26,616.71 All-time high
26,000
28,800.35
25,516
25,316 50 Days moving average
DJ Support: 25,000 20 Days moving average
24,876 2017 peak
24,505
24,280
24,100
23,912
23,600
23,400
23,250 Very strong
23,247 200 Days moving average
23,174
23,002 Strong, gap
22,890
22,795
22,420 Strong, breakout
22,119
22,000
21,912
21,600
21,535
Technical Analysis:
NASDAQ Composite has gotten a new all-time high and it is moving in uncharted territory with a solid up trend. S&P has broken up the negative trend line and it is over 50 days moving average, this last one is now a strong support. S&P trend is bullish but if it breaks down the 50 days moving average it could change, it should attack SP2,800.
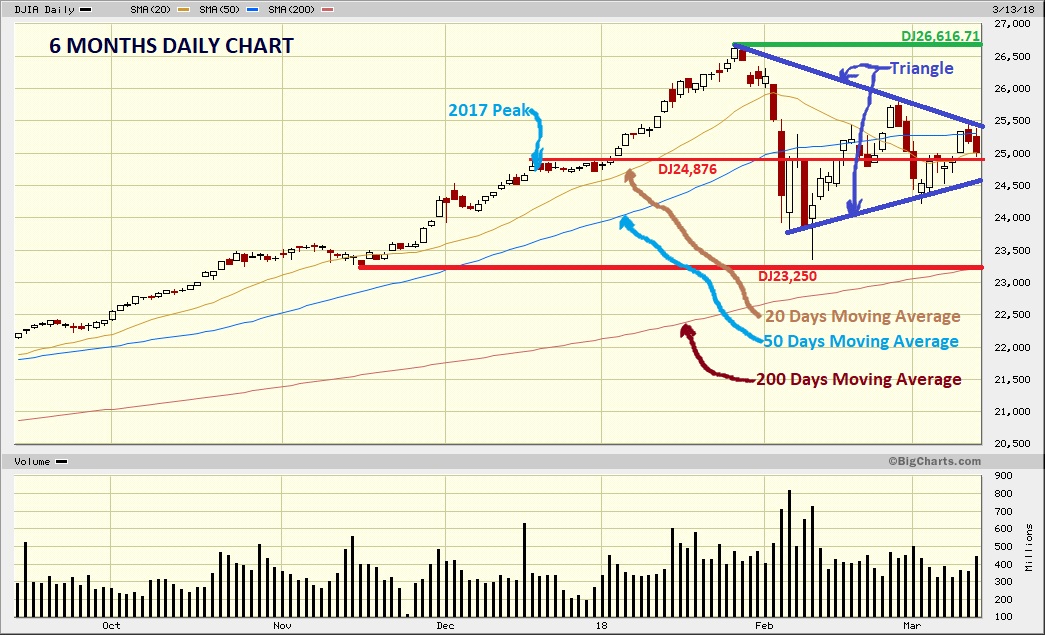
DJIA has formed a symmetrical triangle and the index is still in, it has to break to the up or downside and explode. Next targets to the upside are DJ25,316 (50 days moving average), DJ25,316 and DJ25,800. DJIA trends to the upside in the mid and long term barring a violation at DJ23,250.
There is a "common gap" on Friday, normally that kind of gaps are filled. It is just below DJ25,000.
Please watch the chart where you aregoing to see the battlefield.
Please click over the chart to enlarge it.
Fundamentals:
Last week the market exploded due the excellent job report. The market is mixed during the last days. We can consider that is breathing before more gains. I think this is a profit taking and a reaction from the last uncertainties like the new Secretary of State.
February low seems to be the strong support for the correction. NASDAQ Composite has done new all-time highs, S&P is near its all-time high and DJIA is lagging but supported.
FOMC is for Mach 21st and I expect a probable 0.25 rate increase that could trigger an up move to the all-time highs.
The economy continues its positive path, corporations continue doing money, consumption is strong and the market looks bullish. But we have to pay attention to some instabilities like United Kingdom - Russia about the assassination of the ex-spy, it could escalate. It sems to me that volatility will be present for weeks.
Dear traders and investors, life is not easy and the markets are the same. I am still positive with the stock market and the U.S. economy therefore I expect 10 to 15% gains for 2018.
Good luck, viel Glueck, buona fortuna, buena suerte, bonne chance!
Ulises
26,000
28,800.35
25,516
25,316 50 Days moving average
DJ Support: 25,000 20 Days moving average
24,876 2017 peak
24,505
24,280
24,100
23,912
23,600
23,400
23,250 Very strong
23,247 200 Days moving average
23,174
23,002 Strong, gap
22,890
22,795
22,420 Strong, breakout
22,119
22,000
21,912
21,600
21,535
Technical Analysis:
NASDAQ Composite has gotten a new all-time high and it is moving in uncharted territory with a solid up trend. S&P has broken up the negative trend line and it is over 50 days moving average, this last one is now a strong support. S&P trend is bullish but if it breaks down the 50 days moving average it could change, it should attack SP2,800.
DJIA has formed a symmetrical triangle and the index is still in, it has to break to the up or downside and explode. Next targets to the upside are DJ25,316 (50 days moving average), DJ25,316 and DJ25,800. DJIA trends to the upside in the mid and long term barring a violation at DJ23,250.
There is a "common gap" on Friday, normally that kind of gaps are filled. It is just below DJ25,000.
Please watch the chart where you aregoing to see the battlefield.
Please click over the chart to enlarge it.
Fundamentals:
Last week the market exploded due the excellent job report. The market is mixed during the last days. We can consider that is breathing before more gains. I think this is a profit taking and a reaction from the last uncertainties like the new Secretary of State.
February low seems to be the strong support for the correction. NASDAQ Composite has done new all-time highs, S&P is near its all-time high and DJIA is lagging but supported.
FOMC is for Mach 21st and I expect a probable 0.25 rate increase that could trigger an up move to the all-time highs.
The economy continues its positive path, corporations continue doing money, consumption is strong and the market looks bullish. But we have to pay attention to some instabilities like United Kingdom - Russia about the assassination of the ex-spy, it could escalate. It sems to me that volatility will be present for weeks.
Dear traders and investors, life is not easy and the markets are the same. I am still positive with the stock market and the U.S. economy therefore I expect 10 to 15% gains for 2018.
Good luck, viel Glueck, buona fortuna, buena suerte, bonne chance!
Ulises
miércoles, 7 de marzo de 2018
Dow Jones & S&P formed a triangle
DJ Resistance: 26,616.71 All-time high
26,000
25,800.35
25,500
25,309 50 Days moving average
DJ Support: 24,876 2017 peak
24,719 2017 close
24,715.19 Support of old range
24,500
24,100
23,950
23,600
23,500 Gap upside
23,480 Gap downside
23,250 Strong
23,174
23,089 200 Days moving average
23,002 Strong, Gap
22,890
22,795
22,420 Strong, breakout
22,119
22,000
21,912
21,600
21,535 July peak
Technical Analysis:
The 2017 peak area has acted as support for DJIA and S&P. It has been reconfirmed as a strong support.
The range DJ24,719 (2017 close) and 24,876 (2017 peak) is the strong support for DJIA. The 50 days moving average at DJ25,245 was violated and now is acting as resistance at DJ25,309.
March start is volatile, DJIA and S&P have survived the test of the support at the 2017 peak and close.
A triangle is forming on the daily chart.
We conclude that the charts are irregular and the recovery attempt is still in the charts. The trend continues to be bullish although the last corrections.
Please click over the chart to enlarge it.
Fundamentals:
Some Trump's decisions are creating uncertainties in the financial markets. Uncertainty is terrible for these markets but that passed because what actually counts is the fundamental strength: economy and earnings.
Q4 earnings season was excellent, 2017 PBI growth was 2.5% and expectations for 2018 are 3% or more and it would be the best from 2005. FED Chairman Jerome Powell is enthusiastic around the U.S. economy in my opinion that explains what he mentioned about a possible 4th. rate hike in 2018. This backdrop puts us on the brilliant path.
Consumer Confidence index is at 130 from 2000 is the highest level. Consumer spending maintains a solid pace.
Certainly all of this boost a healthy economy. As I have explained the market is basing before the next leg up. This new base has to be solid and has have digested all the doubts about the spectacular market hike of 2017. My question is if DJ23,250 almost the low of this correction is the low boundary. In my opinion yes but we have to confirm it. I find the S&P well supported right now at SP2,700. This backdrop puts us on a brilliant path.
Dear traders and investors, I am still optimistic with the stock market and I think that the strategy is to continue to buy on the dips.
Good luck, viel Glueck, buona fortuna, buena suerte, bonne chance!
Ulises
26,000
25,800.35
25,500
25,309 50 Days moving average
DJ Support: 24,876 2017 peak
24,719 2017 close
24,715.19 Support of old range
24,500
24,100
23,950
23,600
23,500 Gap upside
23,480 Gap downside
23,250 Strong
23,174
23,089 200 Days moving average
23,002 Strong, Gap
22,890
22,795
22,420 Strong, breakout
22,119
22,000
21,912
21,600
21,535 July peak
Technical Analysis:
The 2017 peak area has acted as support for DJIA and S&P. It has been reconfirmed as a strong support.
The range DJ24,719 (2017 close) and 24,876 (2017 peak) is the strong support for DJIA. The 50 days moving average at DJ25,245 was violated and now is acting as resistance at DJ25,309.
March start is volatile, DJIA and S&P have survived the test of the support at the 2017 peak and close.
A triangle is forming on the daily chart.
We conclude that the charts are irregular and the recovery attempt is still in the charts. The trend continues to be bullish although the last corrections.
Please click over the chart to enlarge it.
Fundamentals:
Some Trump's decisions are creating uncertainties in the financial markets. Uncertainty is terrible for these markets but that passed because what actually counts is the fundamental strength: economy and earnings.
Q4 earnings season was excellent, 2017 PBI growth was 2.5% and expectations for 2018 are 3% or more and it would be the best from 2005. FED Chairman Jerome Powell is enthusiastic around the U.S. economy in my opinion that explains what he mentioned about a possible 4th. rate hike in 2018. This backdrop puts us on the brilliant path.
Consumer Confidence index is at 130 from 2000 is the highest level. Consumer spending maintains a solid pace.
Certainly all of this boost a healthy economy. As I have explained the market is basing before the next leg up. This new base has to be solid and has have digested all the doubts about the spectacular market hike of 2017. My question is if DJ23,250 almost the low of this correction is the low boundary. In my opinion yes but we have to confirm it. I find the S&P well supported right now at SP2,700. This backdrop puts us on a brilliant path.
Dear traders and investors, I am still optimistic with the stock market and I think that the strategy is to continue to buy on the dips.
Good luck, viel Glueck, buona fortuna, buena suerte, bonne chance!
Ulises
Suscribirse a:
Entradas (Atom)


