26,000
25,800.35
25,400
25,304 50 Days moving average
24,990 20 Days moving average
24,876 2017 peak
24,719 2017 close
24,280
24,100
23,912
23,600
23,400
23,382 200 Days moving average
23,250 Very strong
23,174
23,002 Strong, gap
22,890
22,795
22,420 Strong, breakout
22,119
22,000
21,912
21,600
21,535
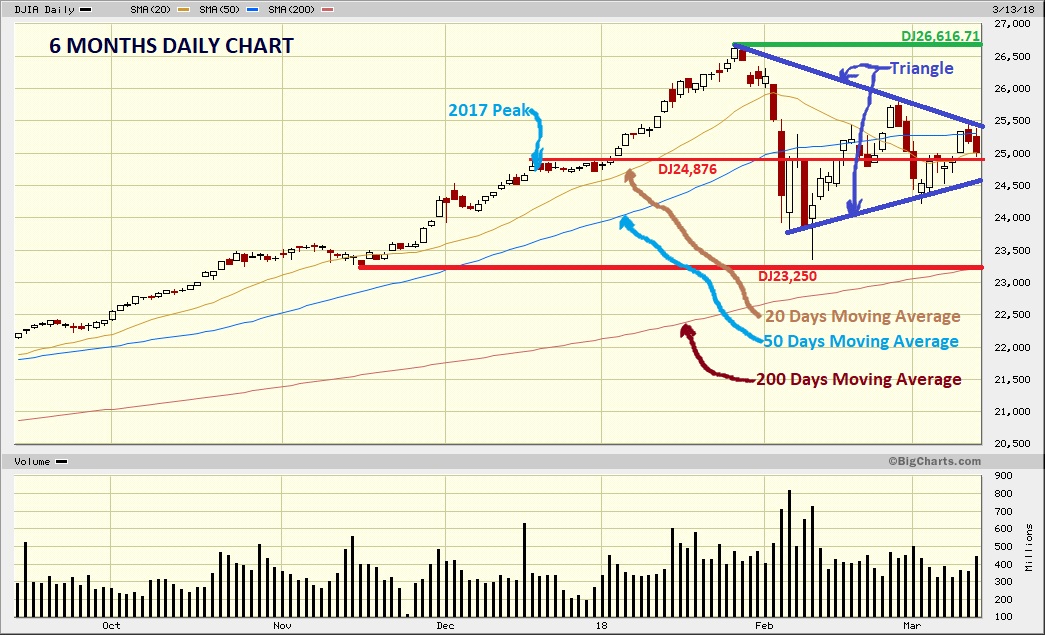
Technical Analysis:
The market is phasing an interest hike and fears of a trade war.
The bears have reemerged and DJIA has broken important supports like 50 days moving average, DJ24,719 2017 close and DJ24,876 2017 peak. DJIA is below 20 and 50 days moving average which is bearish.
DJIA has formed a symmetrical triangle and is near of the vertex. Probably the next backdrop is an explosion to the up or down side. Pay attention to this formation. The negative trend line of the symmetrical triangle shows lower highs that is bearish.
DJIA is the weakest if you compare with the S&P and NASDAQ Composite.
In the short and mid-term the trend is bearish. DJ23,250 should be a strong support and hopefully the downside of the correction.
On the contrary, S&P is over its supports like 2017 close, 2017 peak and 50 days moving average showing an intact recovery attempt.
Please click over the chart to enlarge it.

Fundamentals:
The market fears the Wednesday 3/21/2018 FOMC trade war and Facebook sell-off.
Personally, I think that the FED Meeting Announcement will raise the interest rates 25 basis points and this hike will calm down the markets. Trade war is different because it could affect the consumers. Facebook sell-off was originated due a bad press leak about customer data and millions of user profiles accessed by politicians. The Facebook stocks were sent down but it is a Facebook problem.
The hike of the rates will assure to the market the FED's confidence about the economy therefore I expect a bounce up of the market. The market is in a correction and consolidation phase, personally I expect DJ23,250 as a strong support in this phase but volatility is in place and it could be working for weeks.
Traders will pay attention to Fed's Chair Press Conference, it is the first one by the new Fed Chairman Jerome Powell after Janet Yellen.
Dear traders and investors, volatility is in the market and we have to live with it in the next weeks, hopefully not months. My suggestion is still "Buy the Dip".
Good luck, viel Glueck, buona fortuna, buena suerte, bonne chance!
Ulises