26,000
25,800.35
25,400
24,876 2017 peak
24,719 2017 close
24,623 50 Days Moving average
24,280
24,256 20 Days moving average
24,100
23,500
23,250 Very strong
23,174
23,002 Strong, gap
22,890
22,795
22,420 Strong, breakout
22,119
22,000
21,912
21,600
21,535
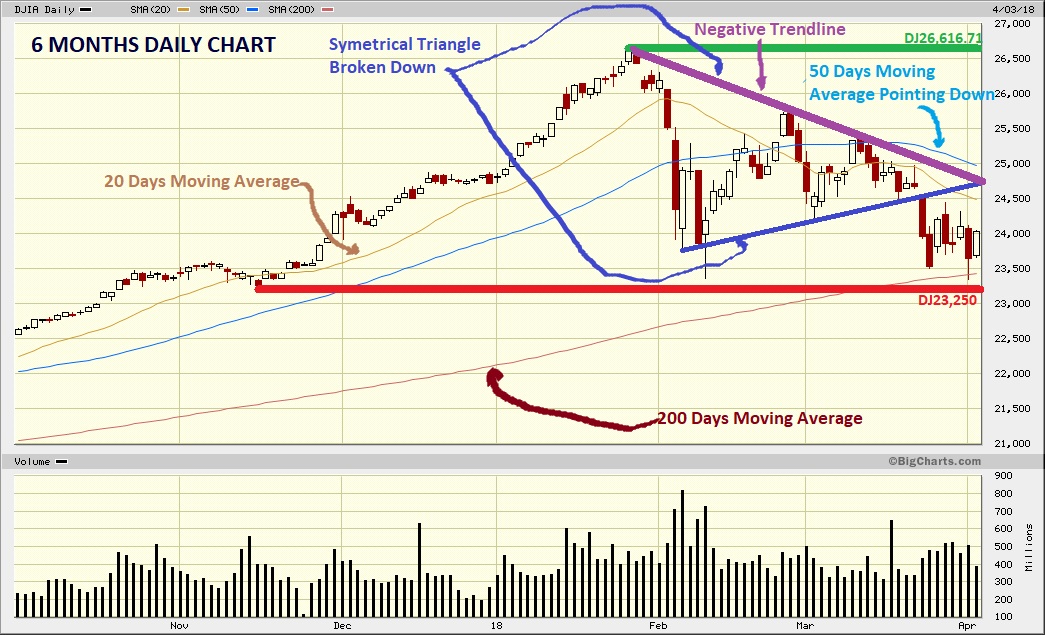
Technical Analysis:
False breakout of the negative trend line and the 50 days moving average, this action indicates the bearish-leaning trend in the medium term. S&P dis almost the same.
DJIA could not to penetrate de resistance DJ24,876 (2017 peak) and returned below its 50 days moving average (DJ24623). If you watch the S&P chart you will realize the same behavior.
DJIA has to close over DJ24,876 (2017 peak) to bring back the bulls.
The three indexes are below its 50 days moving averages and show a failed attempt to recover to the all-time highs.
DJ23,250 should be a strong and an extraordinary support. The correction range is DJ23,250 - 26,616.71
Following the negative trend line (watch the chart) the trend in the midterm is bearish.
Please click over the chart to enlarge it.

The 10 year bond got 3% p.a. because sellers of bonds were active. That put the stock market in alert and we have witnessed how the bounce in April failed. Besides, Caterpillar showed excellent earnings in this first quarter with nice outlook in the future and announced that this one could be the stellar of this year that put the stock Caterpillar and the stock market in a sell mode.
We have to focus in the economy. Earnings season is excellent and we expect positive profits until the season's end. With the corporate tax cut the corporations foresees better benefits in the coming times and its expansions. Last GDP was 2.9% positive in the quarter. The economy is showing a vigorous job growth with low unemployment. The information that we are receiving indicates to us that we are in front of a bolstering economy with solid consumption and the consumer confidence almost in the highest levels.
Dear traders and investors, the market entered in a correction mode which is normal after the 2017 results. I had explained to you some months ago that the volatility would be with us in the next weeks and months. Economy is showing us the path to the expansion and very good times coming. That is what really counts. Concentrate in the facts, analyze them and buy the dips.
Good luck, viel Glueck, buona fortuna, buena suerte, bonne chance!
Ulises