26,000
25,800.35
25,400
24,992 50 Days moving average
24,876 2017 peak
24,719 2017 close
24,500 20 Days moving average
24,280
24,100
23,431 200 Days moving average
23,250 Very strong
23,174
23,002 Strong, gap
22,890
22,795
22,420 Strong, breakout
22,119
22,000
21,912
21,600
21,535
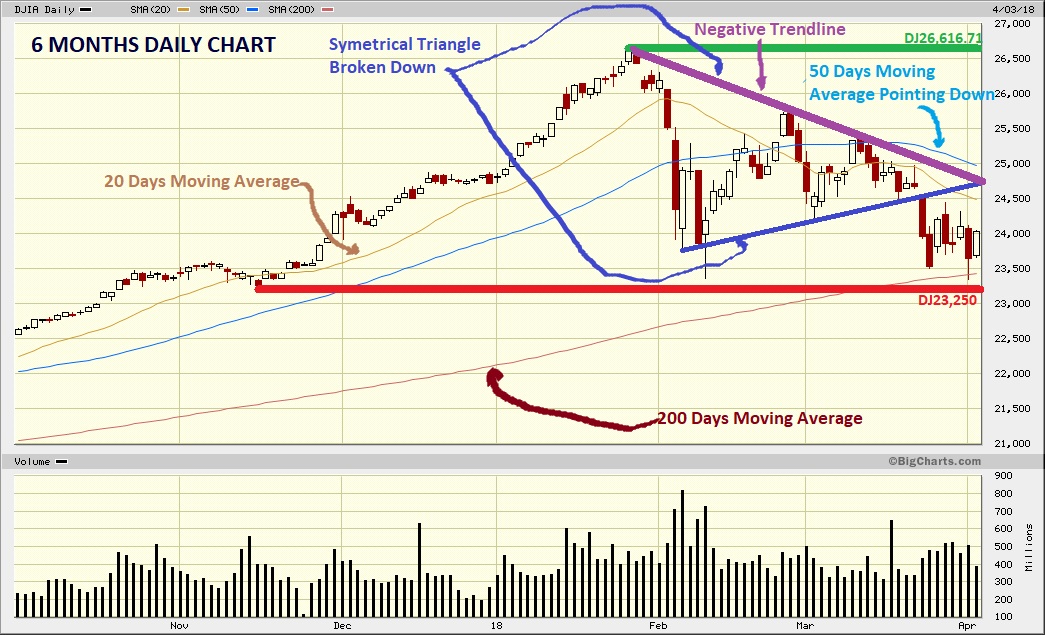
Technical Analysis:
The beginning of the second quarter of this year continues showing the market deterioration.
200 days moving averages works as strong support and is valid at DJ23,431. Other strong support is DJ23,250. Those supports should contain the DJIA although the breakdown of the symmetrical triangle positive trend line. This last breakdown is bearish. The upside attempts have failed when they have tried to break the negative trend line of the symmetrical triangle.
Bulls have to put DJIA over the negative trend line (watch the chart) to repair the chart damages. Other way the trend will continue to the downside.
50 days moving average is pointing down and DJIA is below it same as 20 days moving average. That is bearish.
Bulls target are DJ24,719 (2017 close) and DJ24,876 (2017 peak). Those targets are necessary for the bulls to stabilize DJIA and look for a next higher leg.
S&P have almost violated 200 days moving average.
NASDAQ Composite is set to test 200 days moving average at 6,753.
Conclusion: short and midterm have a bearish trend.
Please click over the chart to enlarge it.
Fundamentals:
S&P 500 index P/E is below 17 times at SP2,600. It is very attractive especially with a growing economy, increasing corporate earnings therefore institutional investors should be looking for the best opportunities in the stock market.
President Trump is intervening in the financial markets with the trade war and accusing Amazon with the low taxes payed by the corporation and its distribution cost through the Post Office. We wait for the next meeting with the dictator of North Korea.
S&P should get SP2,298 to confirm a correction (20%) and to risk to enter in a bear market below this support. The current correction right now is less than 15%. I consider hard to get that level because inflation is controlled, interest rates still are low or we can say accommodative, corporate earnings are in good shape with expectations to be better, the U.S. economy is strong and the global economy is widening or broadening.
Dear traders and investors, the only real risk is the trade war escalating because the excellent projections of the corporate earnings growth for this and next year will disappear. I don't think that it will occur meanwhile I am a buyer on dips and I am clear that volatility will continue being present in the next weeks.
Good luck, viel Glueck, buona fortuna, buena suerte, bonne chance!
Ulises
your post is so informative.get stock market tips from Market Research Company in india
ResponderEliminarPrime Minister Narendra Modi today arrived in Russia's Black Sea coastal city Sochi for an informal summit with President Vladimir Putin- here is option
ResponderEliminarCapitalstars pricing go for it !